This was a Democratic wave election, and every statewide Democrat seemed to benefit except for Kathleen Falk. She significantly underperformed Jim Doyle, and that's what cost her the race. Doyle received 7.3% more votes than Falk did. Had she been able to perform just one percentage point better she would have won the election. Here are the four main theories I've seen given to explain why Falk wasn't able to pick up those votes:
1. The "Blame Madison First" crowd, which includes a significant faction within the Democratic Party, claims that Falk lost because liberal Dane County (Madison) voters were mad she beat Lautenschlager in the primary, and withheld their votes to get even. This article in the Capital Times makes a slightly broader version of this claim: "Although Falk tried to reach out to Lautenschlager's supporters after the primary, Tuesday's results indicated that many of them did not come back to her."
2. A favorite among progressive bloggers is the belief that Falk lost because she didn't have a strong and consistent message, while Van Hollen did. To quote Folkbum, "The campaigns that won here in Wisconsin on Tuesday were the ones with the clear, unambiguous, crystalized messages... JB Van Hollen ran on a single clear message ... I want to fight crime! I'll get the terrorists! I'll clear out the illegal immigrants!" In Effect made a similar point.
3. The far left favors the "Doyle is so corrupt that voters wanted an AG who will keep an eye on him" theory. See this post from The Nate Report for example. Perhaps this will give away my own ideological leanings, but my belief that Falk wouldn't be able to effectively police Doyle was one of the biggest reasons why I supported Lautenschlager in the primary.
4. Kathleen Falk and her supporters complain that Wisconsin Manufacturers and Commerce simply bought the race with several million dollars of attack ads. This is a rather ironic claim since, as I showed here and here, the only reason Falk was even in this race was because she bought her primary victory over Peg Lautenschlager.
So let's look at the data and sort out these somewhat conflicting claims. You can click on any of the maps to get larger versions.
This map shows Falk's underperformance relative to Doyle. As you can see, there's a strong and fairly clear pattern, and this pattern is the clue we need to solve the mystery. But what can we determine from this?
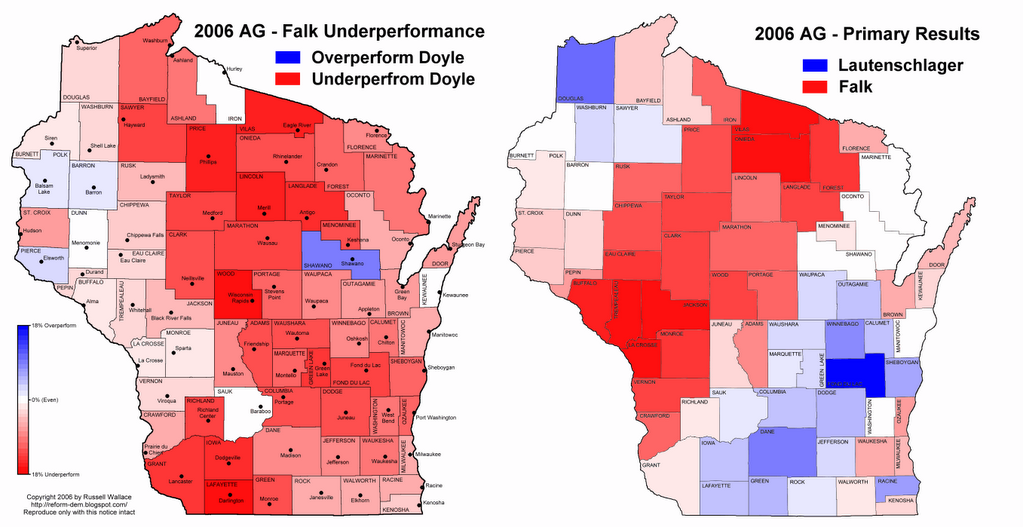
It's certainly clear from the map above that Falk didn't lose because of Dane County, which doesn't stand out as being significantly worse than the rest of the state. In fact, Falk underperformed similarly in both Dane County and Milwaukee County despite losing the primary in Dane County by 20% and winning it in Milwaukee County by 13%. And the pair of maps below shows that bad feelings from the primary race had little to do with the general election. Falk's underperformance is on the left, and the primary election results are on the right. Very different patterns, as you can see.
So we can safely lay to rest the idea that Falk's loss had anything much to do with her nasty primary battle against Peg Lautenschlager. The Democratic base was indeed mad at Falk, Doyle, and the Dem Party establishment for deposing Lautenschlager in the primary, but they still turned out and voted for Falk in the general election.
The next thing to check is if Falk's underperformance compared to Doyle matches with her overall electoral performance. Maybe some voters just didn't vote for the downticket races. But the map below shows it's more complicated that that.

Once again, the map on the left shows Falk's underperformance compared to Doyle, but this time the map on the right shows the AG general election results. They're closer, but still not really a match. I'm not going to bore you with the details, but I also compared Falk's underperformance to the results of the Governor's and the '04 Presidential race, and neither matched very well.
Which finally brings me to the meat of the issue. The thing that correlated most closely with the pattern of Falk's underperformance is Wisconsin TV media markets. This final (I promise!) map again shows Falk's underperformance, but also includes the media markets:

The markets are:
1. Duluth/Superior
2. Wausau/Rhinelander
3. Green Bay/Appleton
4. Minneapolis/St. Paul
5. La Crosse/Eau Claire
6. Madison
7. Milwaukee
Look at, #4 on the map, the Minneapolis/St. Paul market. Three out of the four counties where Falk actually overperformed Doyle are in this market. What's unusual about this market is that Wisconsin campaigns rarely advertise here because it's very expensive and reaches few Wisconsin voters. So it provides us a "pristine" model of what happens when voters don't see TV ads. The fact that Falk did so well there shows that in the absence of TV ads she was quite capable of matching Doyle almost vote for vote. Notice that this also tends to weigh strongly against the theory that voters supported Van Hollen because they wanted an AG to keep an eye on Doyle.
But voters in all the other media markets were inundated with attack ads against Falk from both Van Hollen and Wisconsin Manufacturers and Commerce (WMC). Negative ads are designed to suppress votes, and that's exactly what they did.
But there's still one more piece of the puzzle that I need your help to solve. Check out the La Crosse/Eau Claire market, #5 on the map. Falk's performance wasn't great there, but it was still significantly better than in any of the other remaining markets. Had Falk done this well across the state she would have won. My guess is that either Van Hollen or WMC didn't advertise in that market. If you live in that area please leave a comment and let me know what ads you saw and on which stations.
But what about the message theory? I just don't have enough information to make a good judgment on this one, although it's clearly secondary to the attack ads. But my gut feeling is that Van Hollen gained some additional advantage from his strong and consistent message, and this contributed to his significant overperformance compared to GOP Gubernatorial candidate Mark Green.
There are some anomalies in the maps that I can't explain, such as Shawano and Sauk Counties. If you have any idea what was different about these counties, or any of the others that didn't fit the general pattern, please let me know in the comments.
The results of this election don't bode well for Kathleen Falk's political future. Rightly or wrongly she'll get the blame for costing us the AG's race in what should have been a Democratic sweep. But perhaps even more important is that WMC has shown they don't like Falk, and will go to the mat to keep her out of statewide office. To have any chance of success at running for AG or Governor in the future Falk would probably have to make a deal with WMC, which would mean selling out on her progressive history and values.
The involvement of WMC in this race is one of the reasons I've always felt, and still do, that Peg Lautenschlager would have been a stronger candidate than Falk in the general election. I may be wrong, but I think WMC would have had a much harder time demonizing Lautenschlager, if they had chosen to get involved at all. But this is just speculation.
I've shown pretty conclusively that Falk's loss wasn't due to her divisive primary battle or to voters wanting an AG to keep an eye on Doyle. Turns out the insiders are probably pretty much correct when they say that WMC bought the election. Which seems almost like cosmic justice given that Falk used exactly the same technique to win the primary.
Live by the sword, die by the sword...